Artemis monitoring in OpenShift
Artemis monitoring in OpenShift
It is really simple to monitor the brokers deployed on OpenShift and show the metrics in grafana or configuring alerts based on the metrics. We are using the artemis version included in AMQ 7.9 deployed with the operator.
Configuring user workload monitoring
We can use a custom prometheus operator deployed on OpenShift, or just enable the user workload monitoring following the simple steps on this document
Exposing prometheus metrics
When a set of brokers are deployed, in the deploymentPlan section, the metrics plugin should be enabled. Be sure to use the correct ArtemisBroker Custom Resource version (broker.amq.io/v2alpha5) as previous ones did not include this field.
  deploymentPlan:
    enableMetricsPlugin: true
With that configuration, a prometheus endpoint will be exposed through the console-jolokia endpoint of every broker in the set. We have included this example of a cluster with the configuration enabled.
Prometheus Scrape configuration
When prometheus is deployed in the cluster using the operator, the easiest way to set up the scrape is using a ServiceMonitor Object, like the following one.
apiVersion: monitoring.coreos.com/v1
kind: ServiceMonitor
metadata:
  name: amqbroker-service-monitor
  labels:
    app: demo-app
spec:
  selector:
    matchLabels:
      ActiveMQArtemis: demo
  endpoints:
  - path: /metrics
    port: console-jolokia
Where the label ActiveMQArtemis must match the cluster name.
Once the user workload prometheus server reloads the configuration and start scrapping the metrics, we can look at them in the console as any other workload.
Metrics explained
JVM
The JVM metrics are the usual ones exposed through micrometer for java applications. In this case
jvm_buffer_count_buffers: An estimate of the number of buffers in the pooljvm_buffer_memory_used_bytes: An estimate of the memory that the Java virtual machine is using for this buffer pooljvm_buffer_total_capacity_bytes: An estimate of the total capacity of the buffers in this pooljvm_memory_committed_bytes: The amount of memory in bytes that is committed for the Java virtual machine to usejvm_memory_max_bytes: The maximum amount of memory in bytes that can be used for memory managementjvm_memory_used_bytes: The amount of used memory
Artemis metrics
Artemis metrics can be organized by broker, by address and by queue.
By broker
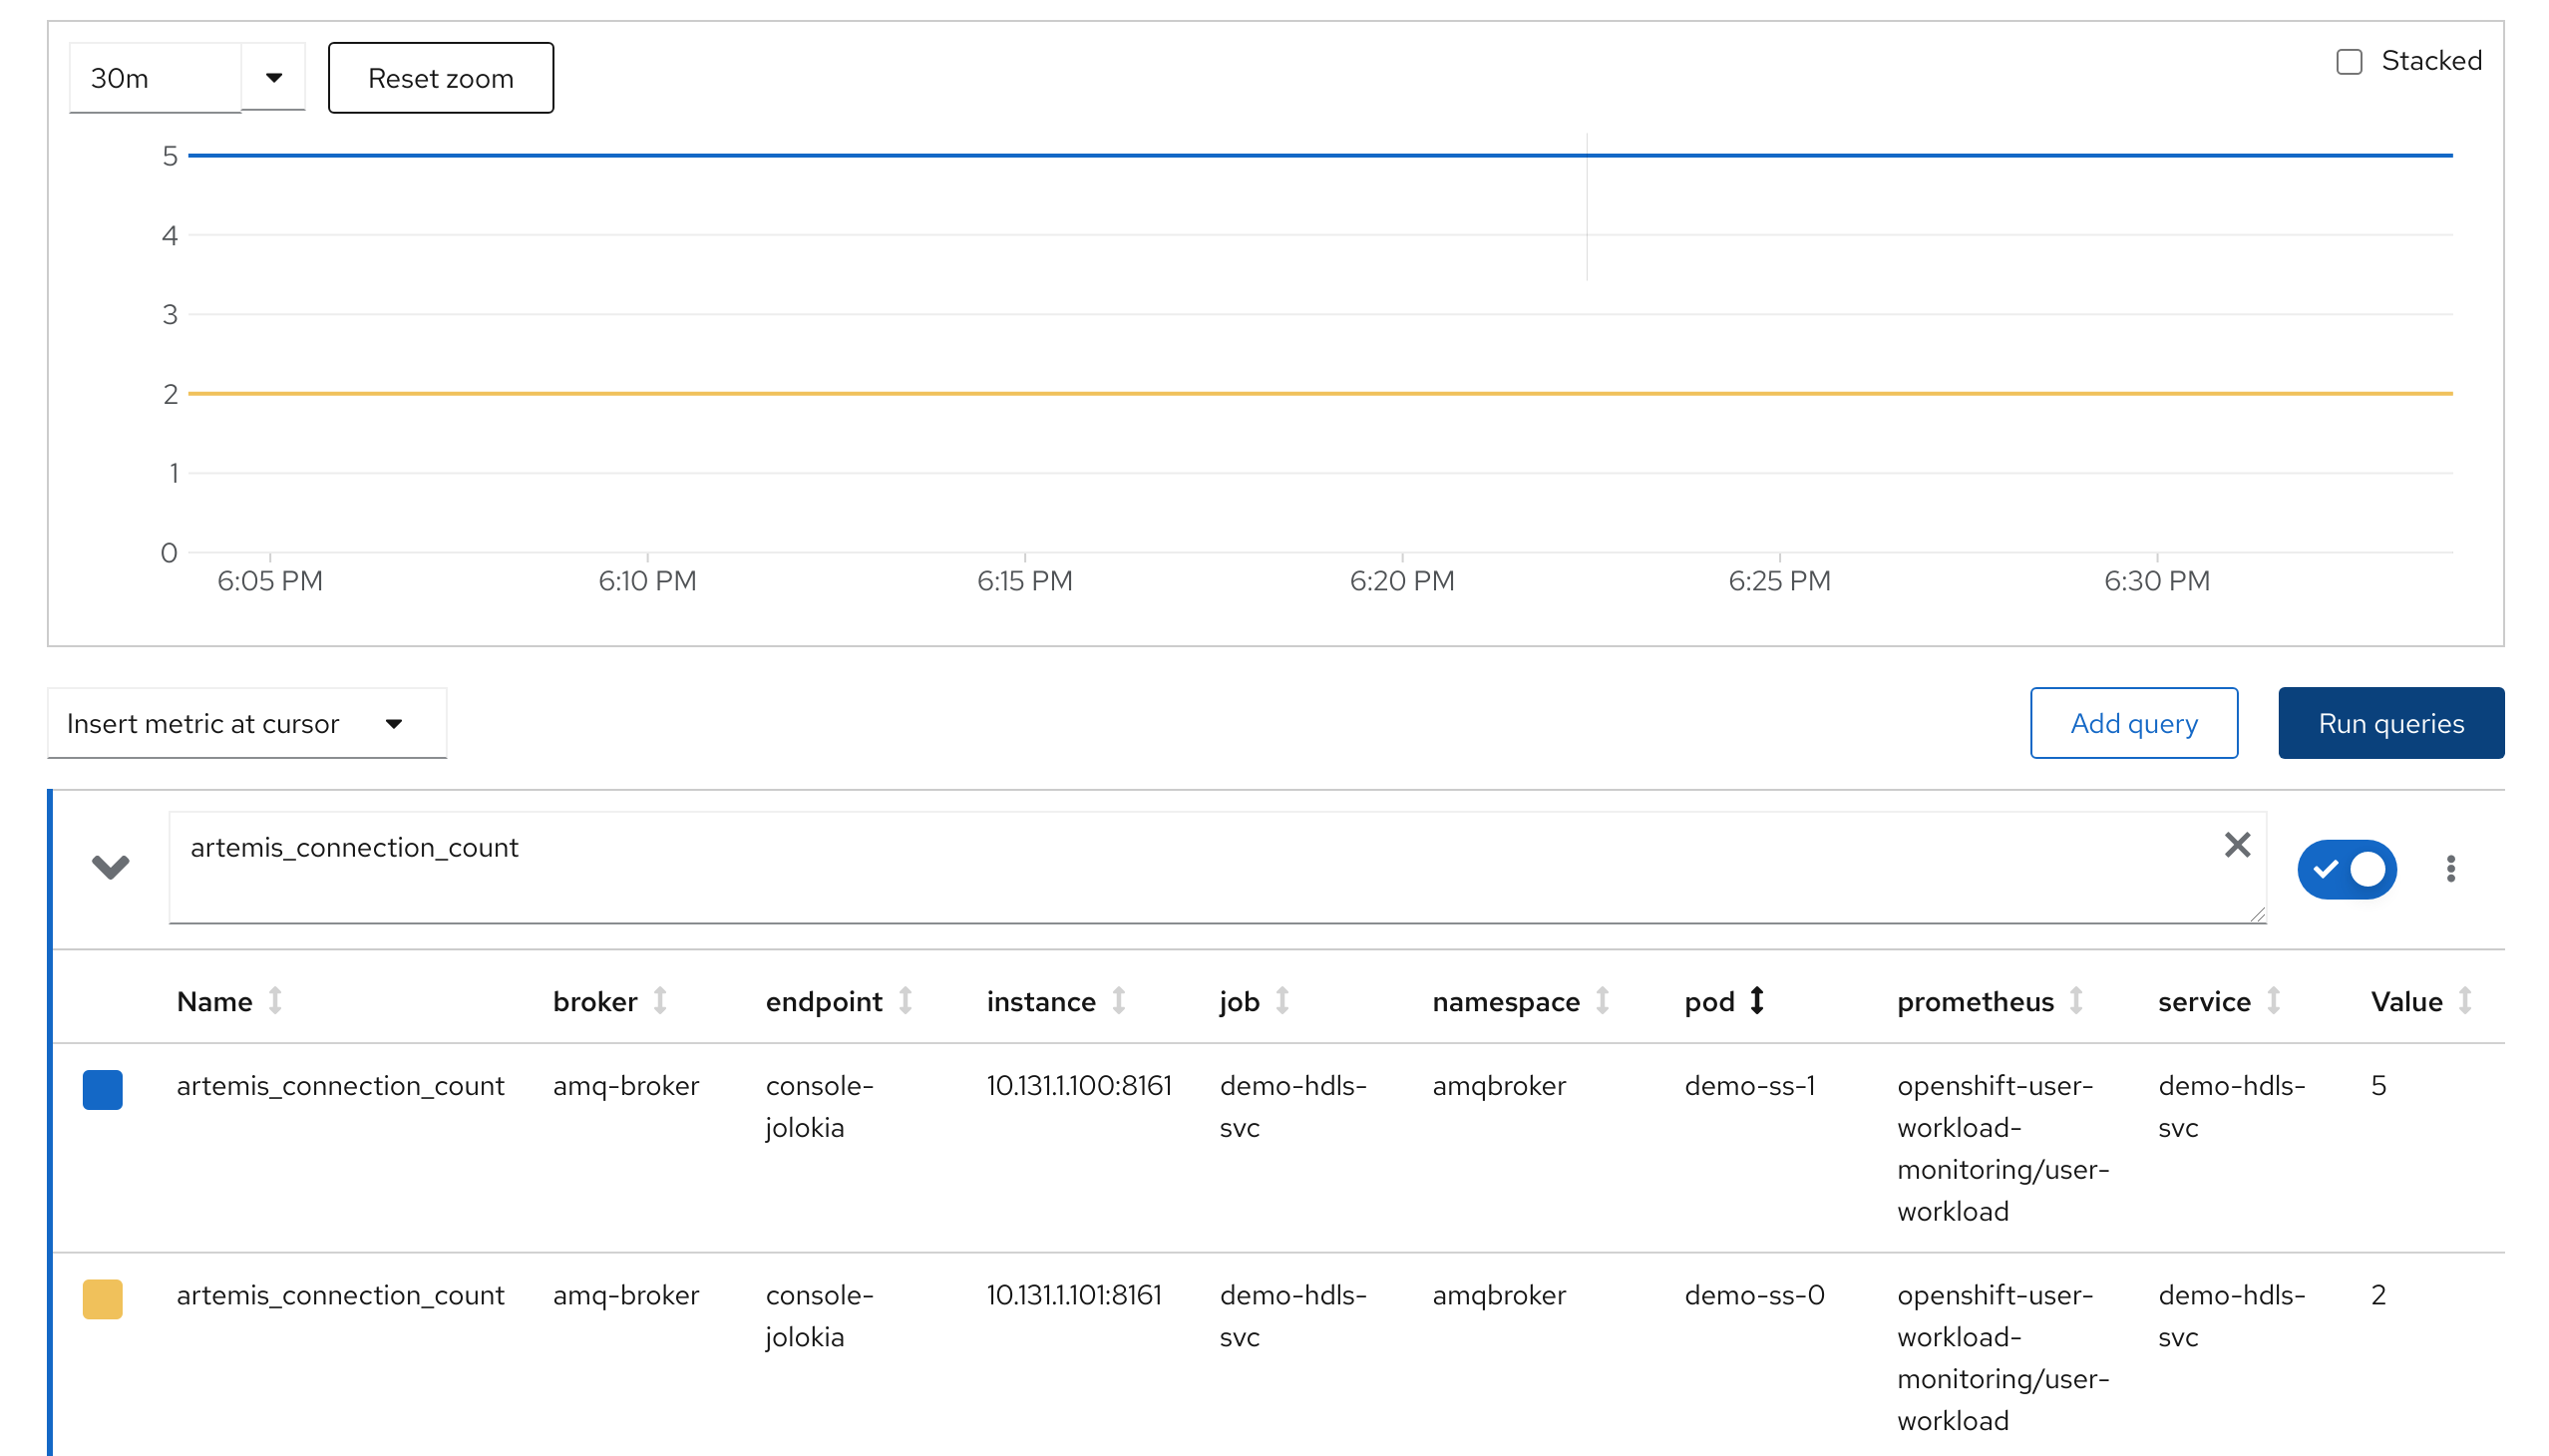
There are five metrics global for a broker, two related with memory, one for disk storage and two more for connections.
artemis_address_memory_usage: Memory used by all the addresses on broker for in-memory messagesartemis_address_memory_usage_percentage: Memory used by all the addresses on broker as a percentage of the global-max-sizeartemis_disk_store_usage: Fraction of total disk store usedartemis_connection_count: Number of clients connected to this serverartemis_total_connection_count: Number of clients which have connected to this server since it was started
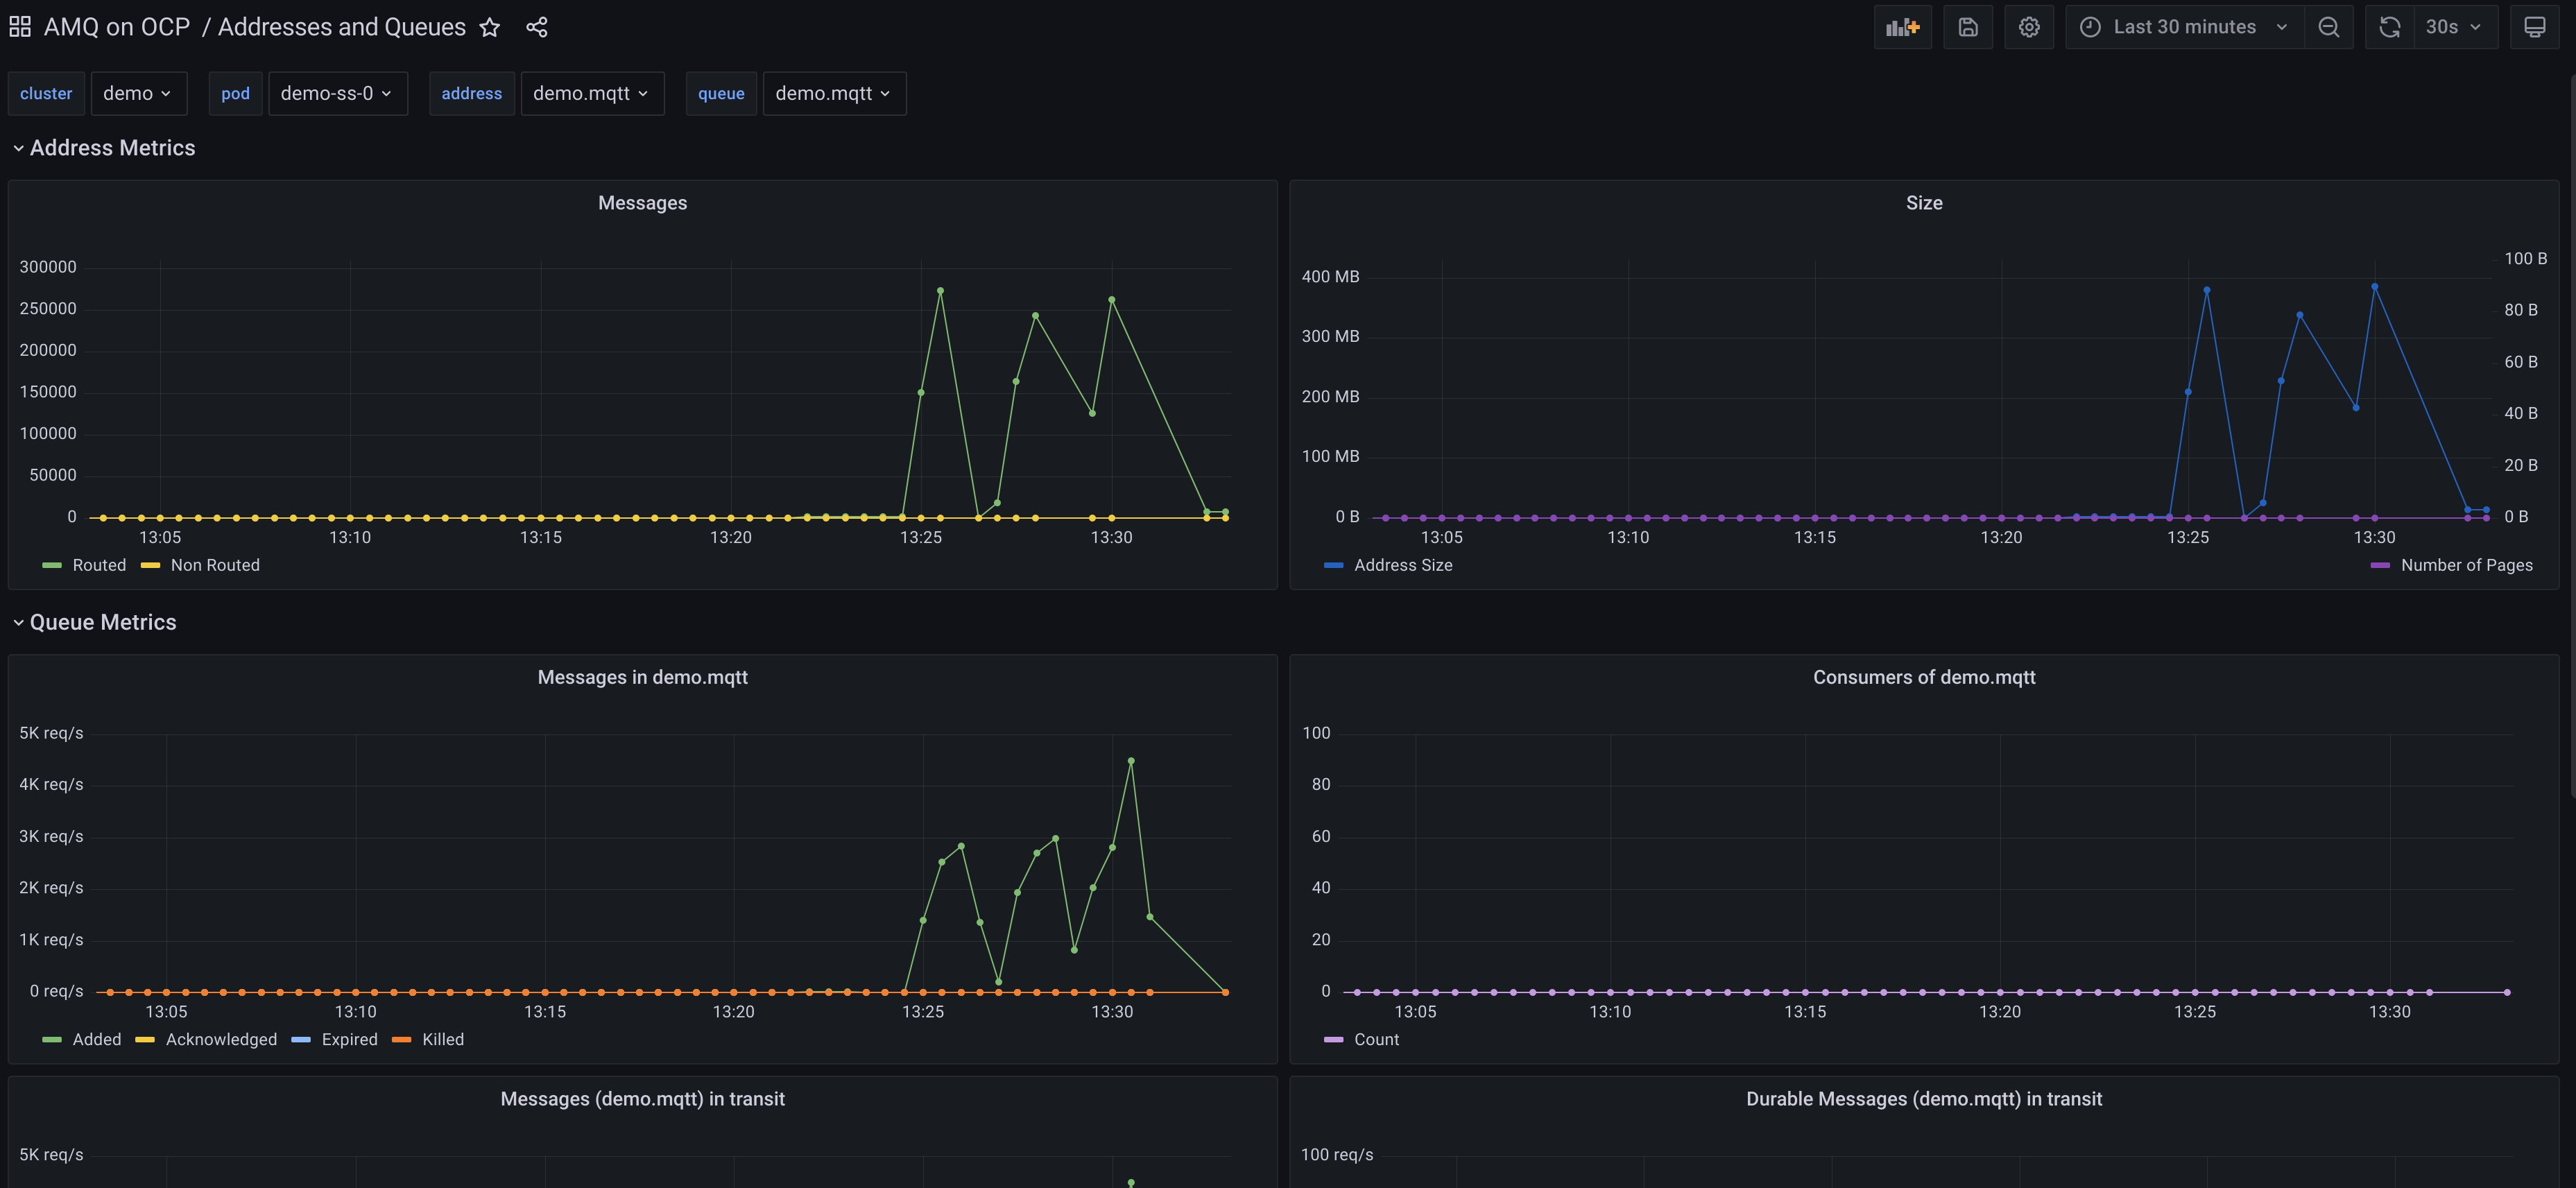
By address
There are four metrics per address in a broker, two related with messages and other two related with storage and pages
artemis_routed_message_count: Number of messages routed to one or more bindingsartemis_unrouted_message_count: Number of messages not routed to any bindingsartemis_number_of_pages: number of pages used by this addressartemis_address_size: the number of estimated bytes being used by all the queue(s) bound to this address; used to control paging and blocking
By queue
Related with consumers:
artemis_consumer_count: number of consumers consuming messages from this queue
Related with reception and store status of messages:
artemis_messages_acknowledged: number of messages acknowledged from this queue since it was createdartemis_messages_added: number of messages added to this queue since it was createdartemis_messages_expired: number of messages expired from this queue since it was createdartemis_messages_killed: number of messages removed from this queue since it was created due to exceeding the max delivery attempts
Related with delivery status of messages in total and durable ones:
artemis_message_count: number of messages currently in this queue (includes scheduled, paged, and in-delivery messages)artemis_scheduled_message_count: number of scheduled messages in this queueartemis_delivering_message_count: number of messages that this queue is currently delivering to its consumersartemis_durable_message_count: number of durable messages currently in this queue (includes scheduled, paged, and in-delivery messages)artemis_scheduled_durable_message_count: number of durable scheduled messages in this queueartemis_delivering_durable_message_count: number of durable messages that this queue is currently delivering to its consumers
Related with size and paging of messages in total and durable ones:
artemis_persistent_size: persistent size of all messages (including durable and non-durable) currently in this queue (includes scheduled, paged, and -artemis_scheduled_persistent_size: persistent size of scheduled messages in this queueartemis_delivering_persistent_size: persistent size of messages that this queue is currently delivering to its consumersartemis_durable_persistent_size: persistent size of durable messages currently in this queue (includes scheduled, paged, and in-delivery messages in-delivery messages)artemis_scheduled_durable_persistent_size: persistent size of durable scheduled messages in this queueartemis_delivering_durable_persistent_size: persistent size of durable messages that this queue is currently delivering to its consumers
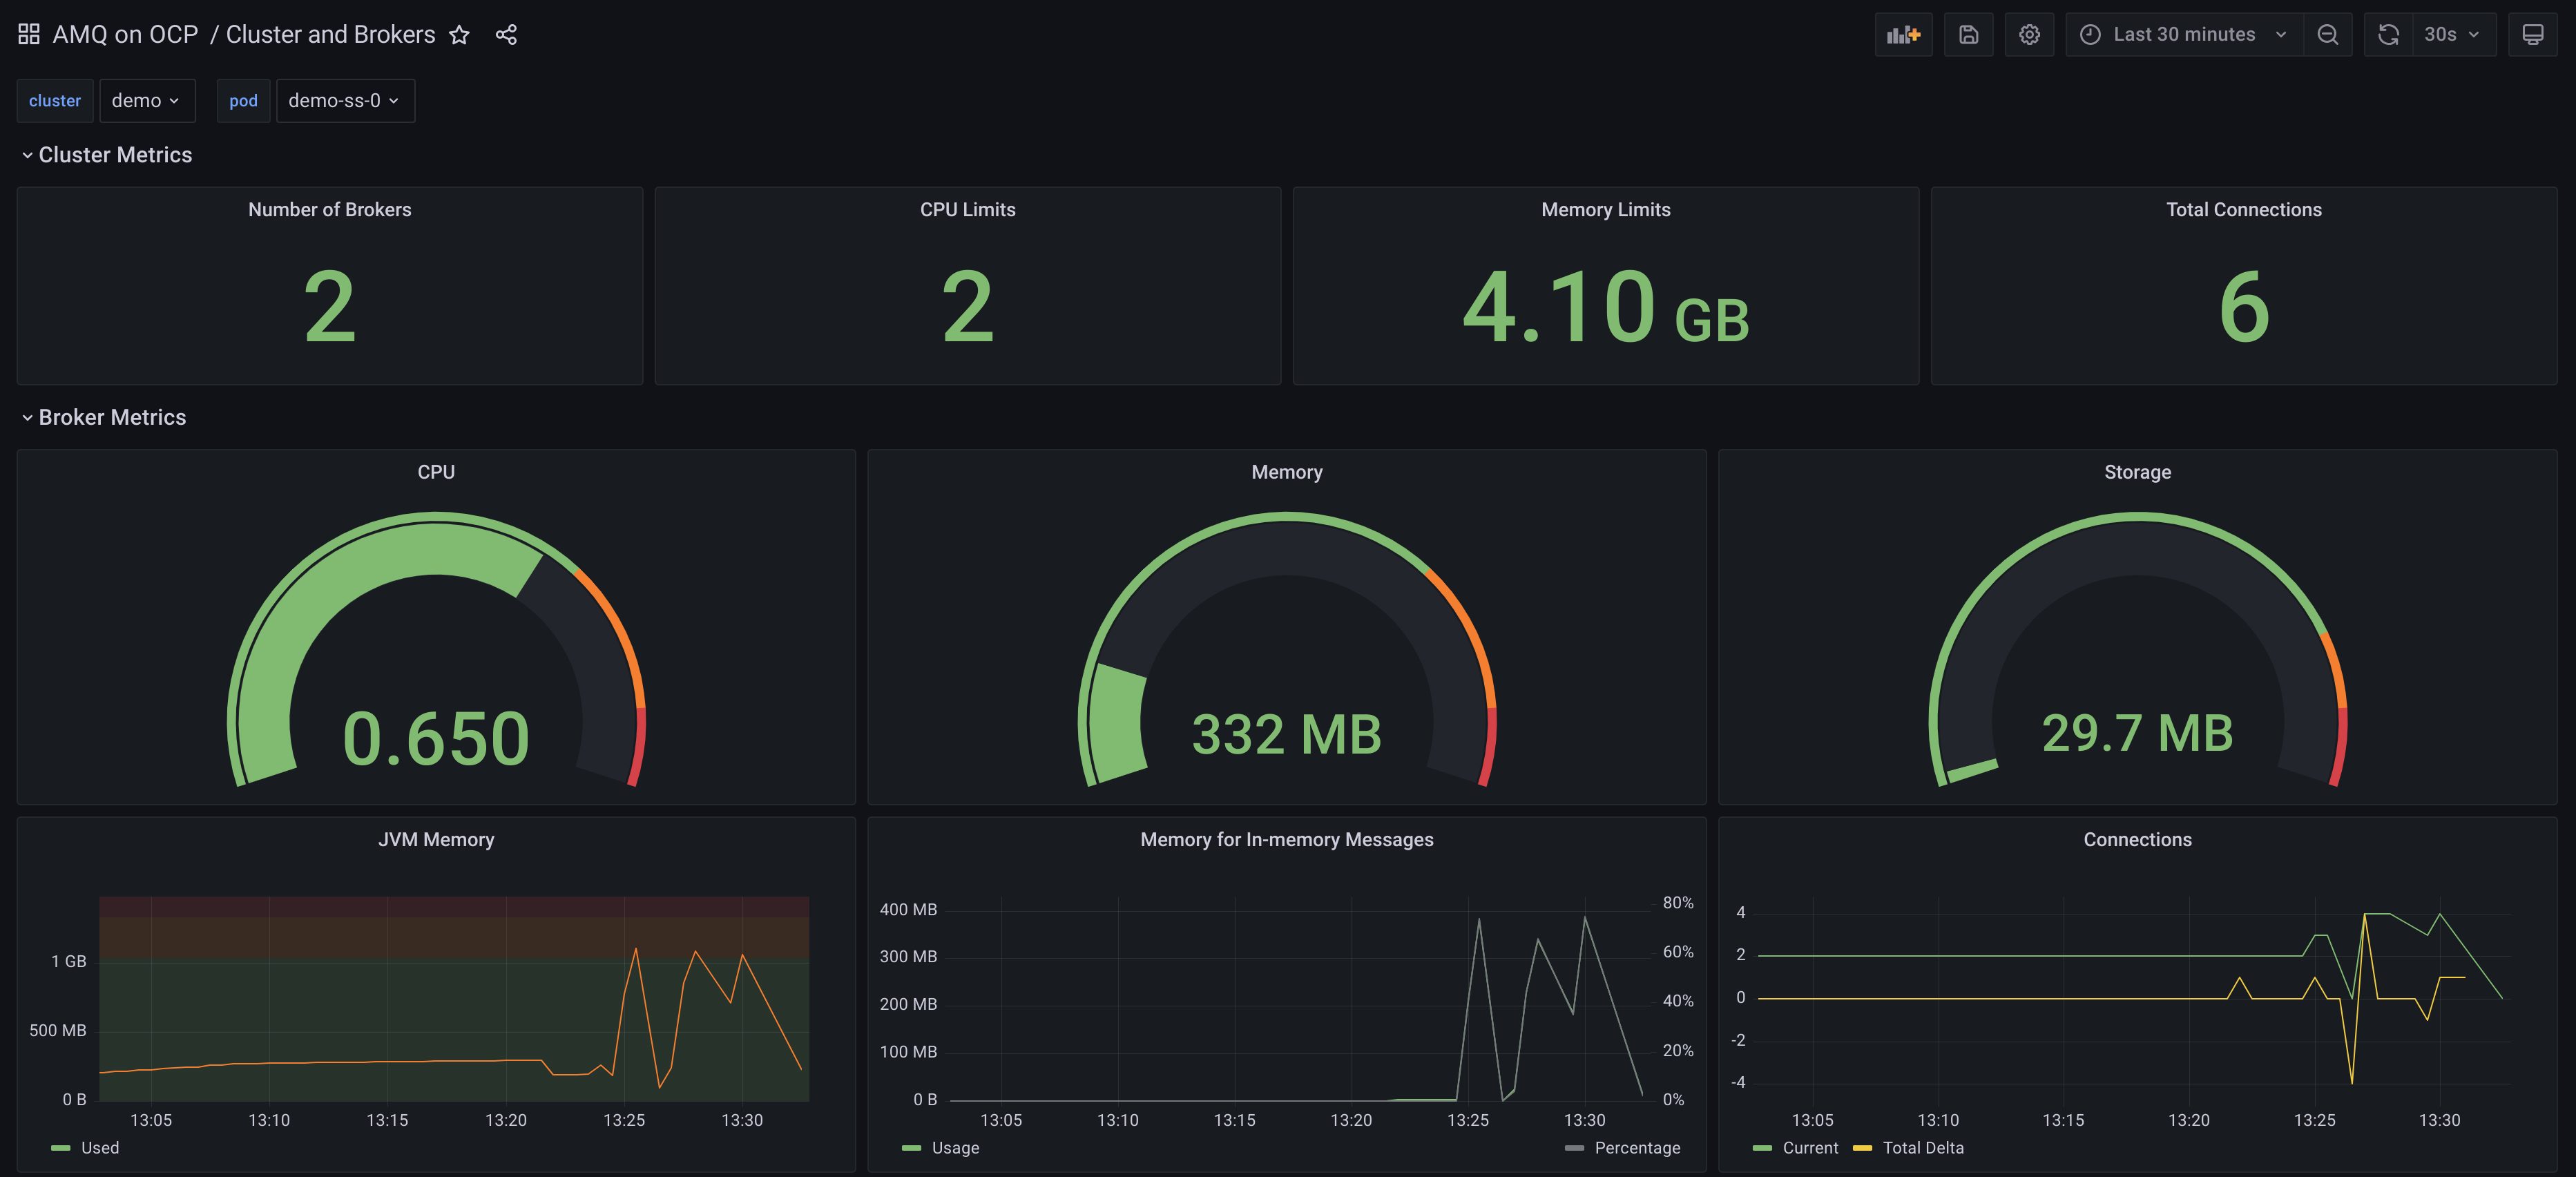
Sample Grafana Dashboards
With all this information in mind, it is pretty easy to build nice dashboards that can show all the metrics, selecting a broker, address in that broker and queue in that address for drilling down on the different levels.
As Kubernetes is also exposing metrics per pod and persistentvolumeclaim, it is very useful to mix both to get a further insight on what is happening.
A sample top level dashboard can be shown in the following picture.
A detailed one can be the following one: