Infinispan monitoring in Kubernetes with Prometheus and Grafana
Infinispan is a java based open source cache and grid solution, that is used extensively in different framework like j2ee, springboot and quarkus among others. It is compatible with different java caching models, like JSR-107 and spring data.
It is very simple to set up a high availability cluster with different replication/distribution configurations, and thanks to the kubernetes operator pattern, is even easier in kubernetes distribution.
Prometheus is the defacto standard for metric scraping and short-term storing to identify potential issues. It is a graduated project of the CNCF Foundation.
Grafana is a very popular graphing tool that can create nice and easy to use dashboards, created and maintained by Grafana Labs.
We can see the architecture that we are going to test in the following picture.

Kubernetes initial setup
For this example, I am going to use a minikube installation in my fedora, and for the dns I use a dnsmasq domain configuration, but the ingress-dns addon can be use indistinctly. The ingress dns wildard selected from now on will be minikube.cloud. My dnsmasq.conf (172.17.0.2 is from minikube ip command) is as follows.
address=/.minikube.cloud/172.17.0.2Deploying the Operator Lifecycle Manager
The Operator Lifecycle Manager (OLM) is part of an infrastructure that bundles an operator deployment, CRDs and dependencies (use to be RBAC objects) in a simple an easy way. OperatorHub
At the time of writing this post, the current version is 0.15.1. To deploy it, just with a cluster-admin user, execute.
curl -sL https://github.com/operator-framework/operator-lifecycle-manager/releases/download/0.15.1/install.sh | bash -s 0.15.1Or just execute minikube addons enable olm.
Deploying the Infinipan Operator
We are using the kubernetes operator. To deploy it, just create an infinispan-operator.yaml with the following content (from now on, replace infinispan namespace if any other is selected for this test).
apiVersion: v1
kind: Namespace
metadata:
  name: infinispan
---
apiVersion: operators.coreos.com/v1
kind: OperatorGroup
metadata:
  name: operatorgroup
  namespace: infinispan
spec:
  targetNamespaces:
  - infinispan
---
apiVersion: operators.coreos.com/v1alpha1
kind: Subscription
metadata:
  name: infinispan
  namespace: infinispan
spec:
  channel: stable
  name: infinispan
  source: operatorhubio-catalog
  sourceNamespace: olm
Deploying an Infinispan Cluster using the operator
Note: This article use infinispan operator 1.1.2. Some important updates are expected for 2.0 that may change some details. Please, check the version deployed on your installation.
The process described here is based on the official documentation for deploying the operator: infinispan operator documentation. If anything else is needed, refer to that documentation as a reference.
The infinispan operator ensures the cluster to be secured at least with credentials. We are setting our own ones, but if you prefer the operator to create a random ones, just don’t set up the secret and it will be automatically populated in the deployment.
The infinispan image looks for credentials structured in a file called identities.yaml.
We can encode in base64 this file and pass it as data or just add it as is in stringData and then, we can create the infinispan Custom Resource (CR) instance to create the cluster. Create a file called
infinispan-cluster.yaml.
apiVersion: v1
kind: Secret
metadata:
  name: infinispan-basic-auth
  namespace: infinispan
stringData:
  identities.yaml: |-
    credentials:
    - username: developer
      password: dIRs5cAAsHIeeRIL
    - username: operator
      password: uMBo9CmEdEduYk24
---
apiVersion: infinispan.org/v1
kind: Infinispan
metadata:
  name: infinispan-minimal
  namespace: infinispan
spec:
  image: infinispan/server:11.0
  replicas: 3
  service:
    type: DataGrid
  security:
endpointSecretName: infinispan-basic-authkubectl create -f infinispan-cluster.yaml -n infinispanTo check the identities are ok, or recover them in the future, we can execute.
kubectl get secret infinispan-basic-auth -o jsonpath="{.data.identities\.yaml}" | base64 -dI recommend using hotrod protocol to communicate from clients to servers, as it is optimized for achieving the best performance. For example, clients keep topology updated for faster store/retrieval in case of distributed caches. However, to simplify this example, I am going to use the REST interface. I can do with containers inside kubernetes, or expose through load balancers or nodeports defined in the operator. As I am used to create ingresses for that, I will do the same. Create a file called infinispan-ingress.yaml.
apiVersion: networking.k8s.io/v1beta1
kind: Ingress
metadata:
  name: infinispan-minimal
  namespace: infinispan
  annotations:
    kubernetes.io/ingress.class: nginx
    nginx.ingress.kubernetes.io/affinity: cookie
spec:
  rules:
    - host: infinispan-minimal.minikube.cloud
      http:
        paths:
          - path: /
            backend:
              serviceName: infinispan-minimal
              servicePort: 11222
And create the ingress based on that file.
kubectl create -f infinispan-ingress.yamlTo double check if the cluster is up and running, you may execute some API REST commands.
curl -X GET -u developer:dIRs5cAAsHIeeRIL -H "Content-Type: application/json" http://infinispan-minimal.minikube.cloud/rest/v2/serverThe result should be the version details.
{"version":"Infinispan 'Corona Extra' 11.0.0.Final"}Or you can go to http://infinispan-minimal.minikube.cloud/console/, and with the credentials above, you will see the infinispan console.
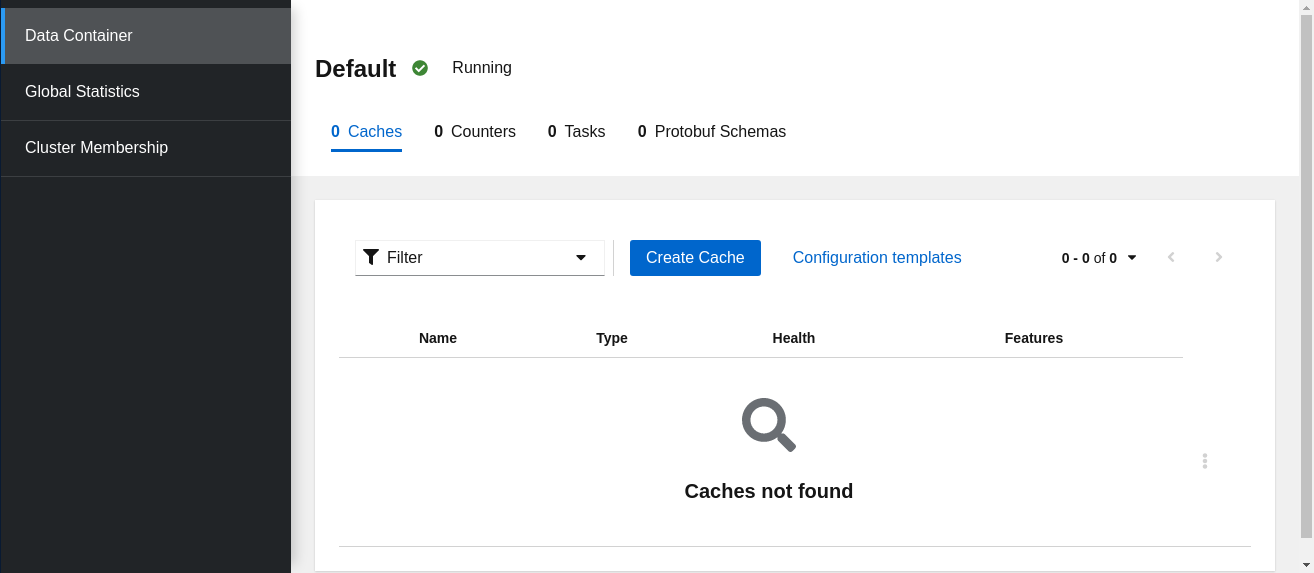
Creating a Cache and adding some data
After deploying the cluster, infinispan has no caches configured (but some internal ones, defined with __name__). We are creating a sample cache named “fruit”, with the following configuration in
default.json.
{
    "distributed-cache": {
        "mode": "SYNC",
        "owners": 1,
        "partition-handling": {
            "when-split": "ALLOW_READ_WRITES",
            "merge-policy": "REMOVE_ALL"
        },
        "transaction": {
            "mode": "NONE"
        },
        "memory": {
            "off-heap": {
                "size": 96468992,
                "eviction": "MEMORY",
                "strategy": "REMOVE"
            }
        },
        "statistics": true
    }
}
Then, create the cache.
curl -X POST -u developer:dIRs5cAAsHIeeRIL -H "Content-Type: application/json" http://infinispan-minimal.minikube.cloud/rest/v2/caches/fruits --data-binary "@default.json"We can query the cache list.
curl -X GET -u developer:dIRs5cAAsHIeeRIL -H "Content-Type: application/json" http://infinispan-minimal.minikube.cloud/rest/v2/caches/You can get some output like this.
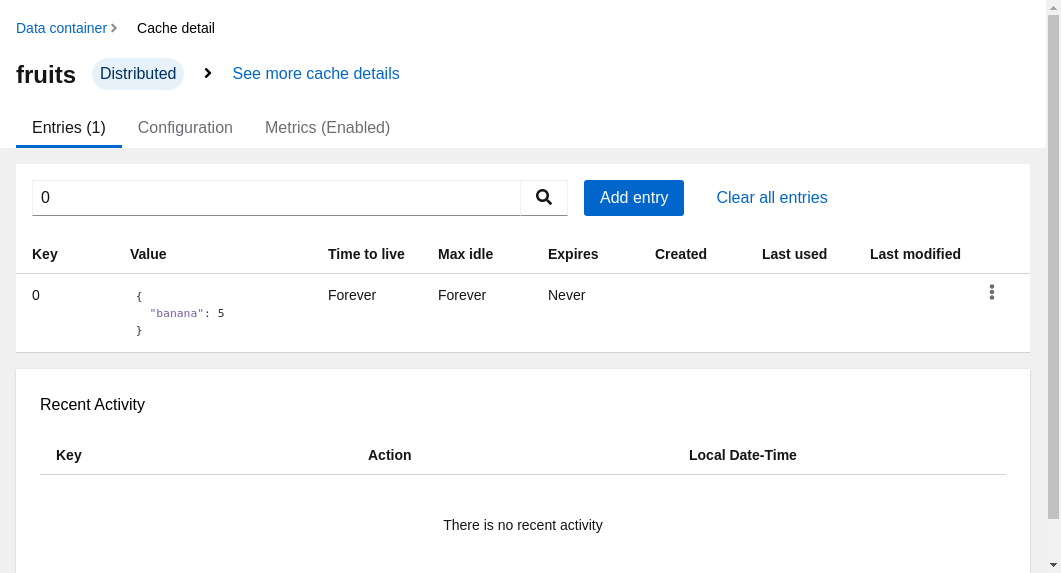
["___protobuf_metadata","fruits","___script_cache"]We can add some records to the cache, for example.
curl -X POST -u developer:dIRs5cAAsHIeeRIL -H "Content-Type: application/json" http://infinispan-minimal.minikube.cloud/rest/v2/caches/fruits/0 --data '{ "banana": 5 }'And query the API or just go to the console and see if this entry is there.
Adding Prometheus Server using the operator
There are different alternatives to deploy and configure a prometheus server and its rules to scrape the targets. I am selecting to use the coreos operator, as it can be used with olm as I did previously with infinispan.
As it is installed cluster-wide, the target namespace operators is already set up by the olm installation. We only need one file,
prometheus-operator.yaml (you may use
https://operatorhub.io/install/prometheus.yaml if you prefer, but I like to change the name from my-prometheus to infinispan-prometheus).
apiVersion: operators.coreos.com/v1alpha1
kind: Subscription
metadata:
  name: infinispan-prometheus
  namespace: operators
spec:
  channel: beta
  name: prometheus
  source: operatorhubio-catalog
sourceNamespace: olmkubectl create -f prometheus-operator.yamlNow, we need to create a prometheus instance to scrape our infinispan metrics.
apiVersion: monitoring.coreos.com/v1
kind: Prometheus
metadata:
  labels:
    prometheus: k8s
  name: infinispan
  namespace: operators
spec:
  alerting:
    alertmanagers: []
  replicas: 1
  ruleSelector: {}
  securityContext: {}
  serviceAccountName: prometheus-k8s
  serviceMonitorSelector: {}
Good! Now we create a ServiceMonitor for our Infinispan cluster. We need also to add the credentials to access the secured endpoint. Just create a file called prometheus-service-monitor.yaml with the following content.
apiVersion: v1
stringData:
  username: developer
  password: dIRs5cAAsHIeeRIL
kind: Secret
metadata:
  name: prom-infinispan-basic-auth
  namespace: operators
type: Opaque
---
apiVersion: monitoring.coreos.com/v1
kind: ServiceMonitor
metadata:
  labels:
    k8s-app: prometheus
  name: infinispan-monitoring
  namespace: operators
spec:
  endpoints:
    - basicAuth:
        password:
          key: password
          name: prom-infinispan-basic-auth
        username:
          key: username
          name: prom-infinispan-basic-auth
      interval: 30s
      scheme: http
      targetPort: 11222
  namespaceSelector:
    matchNames:
      - infinispan
  selector:
    matchLabels:
      app: infinispan-service
      clusterName: infinispan-minimal
And create the objects in the cluster.
kubectl create -f prometheus-service-monitor.yamlI recommend to create an ingress to the prometheus server, so we can check if the endpoints are correctly scraped and we are getting all the metrics that we want. With the following prometheus-ingress.yaml.
apiVersion: networking.k8s.io/v1beta1
kind: Ingress
metadata:
  name: prometheus
  namespace: operators
  annotations:
    kubernetes.io/ingress.class: nginx
spec:
  rules:
    - host: prometheus.minikube.cloud
      http:
        paths:
          - path: /
            backend:
              serviceName: prometheus-operated
              servicePort: web
And creating it.
kubectl create -f prometheus-ingress.yamlSo you should see the targets like in the following picture.
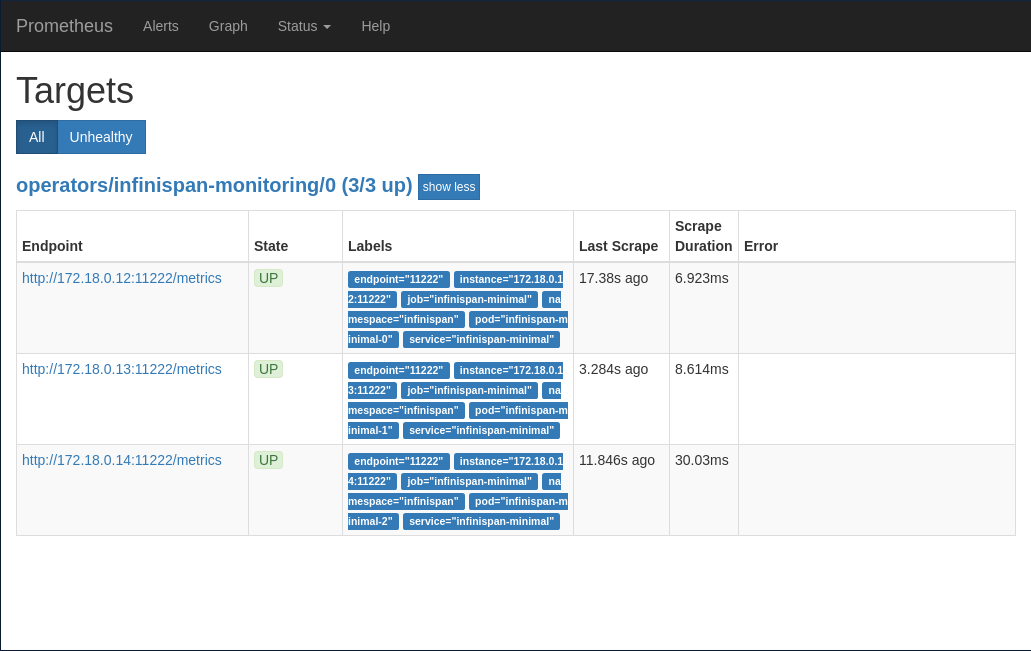
And then, you can try and query a metric from the new cache.
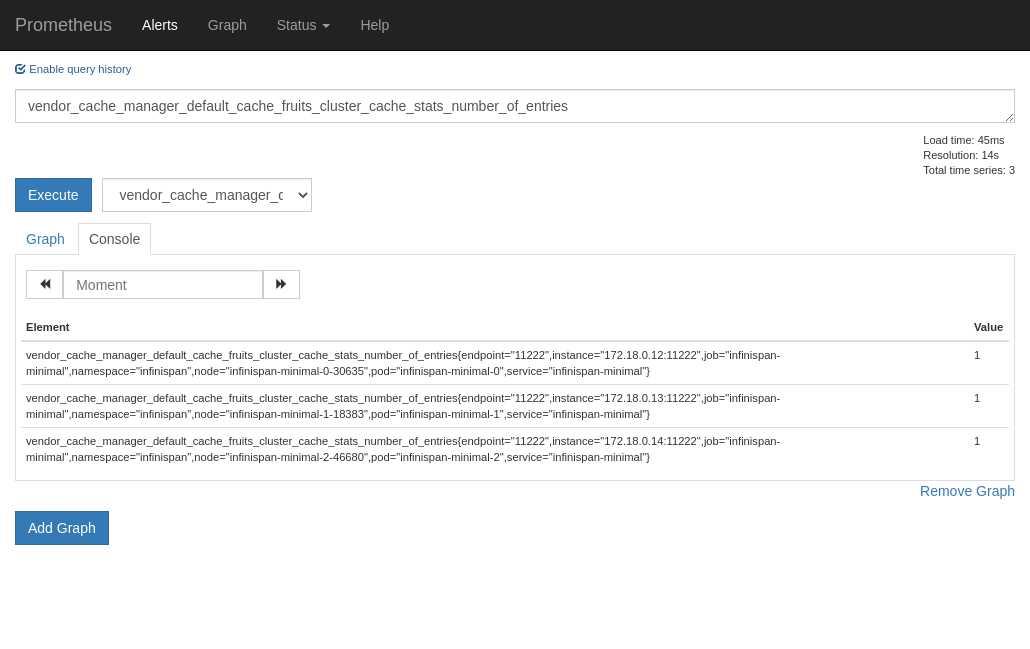
Deploying Grafana
To deploy Grafana on kubernetes cluster, we will use the official helm charts from. We can add the repo to helm, or just use the remote bundle. We are using a values.yaml
helm install infinispan-grafana grafana -f values.yaml --repo https://kubernetes-charts.storage.googleapis.com With this values, you get the prometheus datasource already configured. You may create your own dashboard, or just import this two samples that I created, a General and a Detailed templated for a cache.
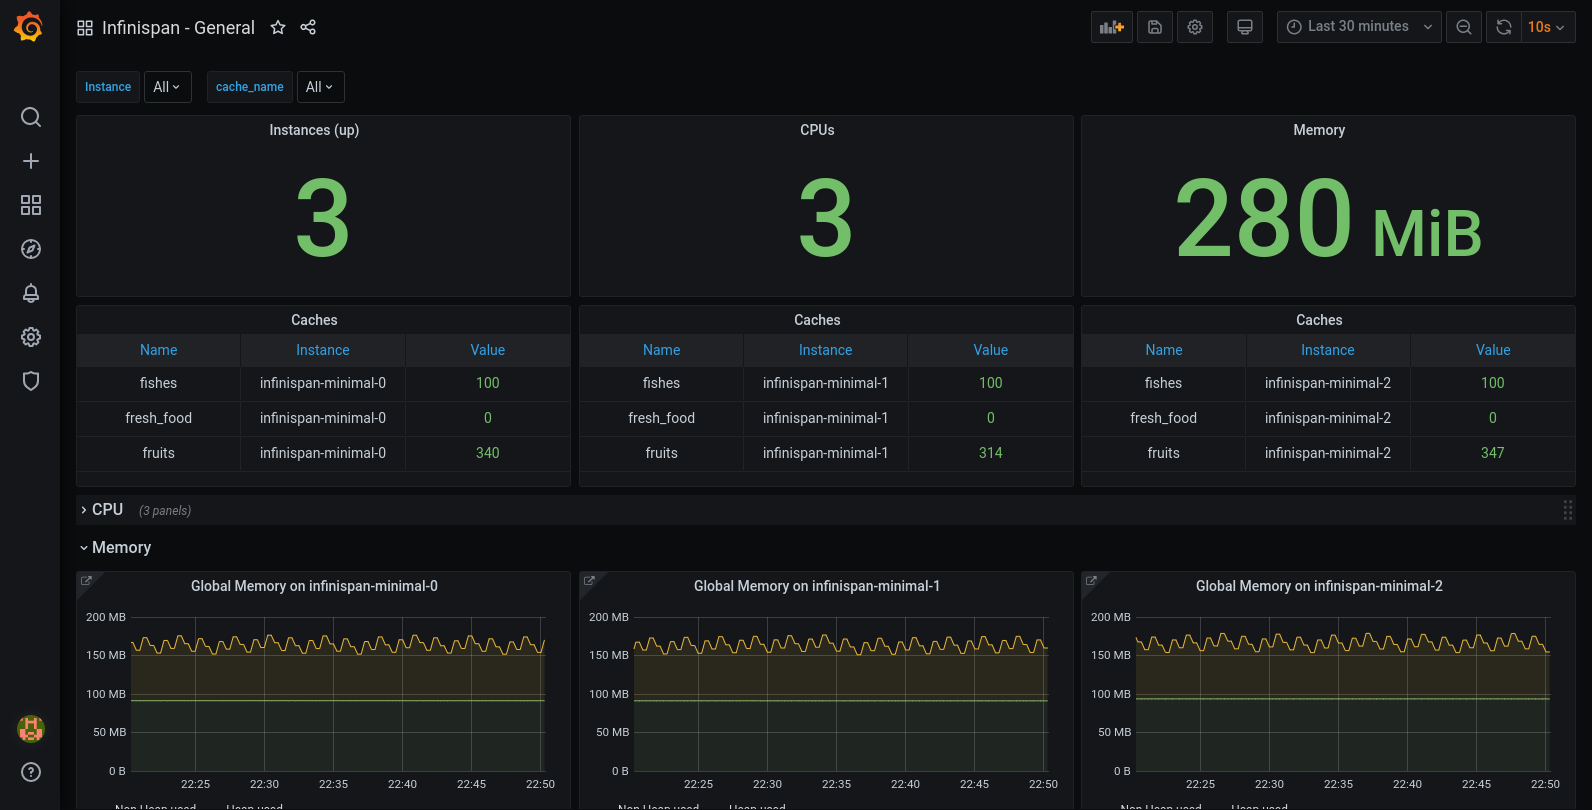
The General dashboard with this setup can be something like the following picture.
Code
All the code used in this post can be downloaded at this github repo.